Spreadsheet based BI

Spreadsheet Based BI - It can be defined as collecting data from different sources and than visualizing in a spreadsheet like interface rather than a dashboard.
What is spreadsheet based BI?
Spreadsheet-based BI is not new. While the term might be new, it’s just describing something that’s been happening for decades.
Do you remember the last time you or a team member extracted a CSV file from your back office, CRM or another system, dumped it in Excel, and did a pivot table to answer a question you had?
Well, that’s spreadsheet-based BI. You used Excel (a spreadsheet) to analyze data and answer key business questions (that’s Business Intelligence).
Why do Spreadsheet based BI?
If you’re in the data industry, you probably consider the workflow I described earlier (export csv -> paste to excel -> analyze) as an aberration.
You’re thinking “we should build a data warehouse and install a BI tool like Tableau or Looker”
Yes, you should probably do that. Now that creates new problems.
Most business users are not super comfortable using a BI tool. So if they need something, they’ll ask the data team. The data team might be overwhelmed with requests. They’ll need to prioritize and some teams won’t have what they need fast enough.
Spreadsheet based BI tools
As we mentioned, the workflow of extracting a CSV and pasting it on Google Sheets / Excel is very manual, error prone and not scalable. As a result, you have a whole category of tools that try to solve this while keeping the advantages of the spreadsheet interface (ease of use and flexibility). There are two main categories
- Plugins / connectors: these tools connect your data sources to Google Sheets or Excel so that you can get your data updated automatically in your spreadsheet. The cons are:
- As Google Sheets / Excel were not purposely built for BI, it’s typically challenging to build fully automated dashboards.
- Google sheets and excel will become very slow once you reach a certain volume of data
- New spreadsheet software built for spreadsheet BI: these tools recreate from scratch a new interface, more or less close to the traditional spreadsheet interface. The cons are:
- Depending on the tools, you may have some learning curve to understand the difference with Google Sheets / Excel.
- As they’re still quite new, they’re typically not at feature parity with Excel / Google sheets
Use cases for spreadsheet based BI tools
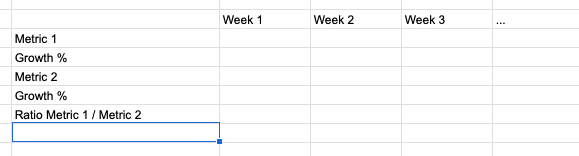
Week on week dashboards
When you want to have a week on week view (or month on month) with a list of metrics and understand how they evolve, there’s really no better format than a spreadsheet. Having these dashboards also enables users to easily calculate some ratios that may not be incorporated in the dashboard in the first place.
Mixing data from a data warehouse and manual inputs
In an ideal world, any relevant data would be centralized in the data warehouse. In practice, it’s rarely the case. Having reports built in spreadsheets lets you easily use data input manually by business users. For example, maybe you’re missing the costs of your products in your data warehouse. In such a case, it’s key for business team to have the flexibility to input manually this data to be able to calculate gross margins and other key metrics. A second example is targets and forecasts. These are numbers that you may want to change frequently and not have “frozen” as they are in a data warehouse. Spreadsheets let you easily compare actuals (calculated from your data warehouse) with targets and forecasts that you can input manually.
Operational tools
The third category of use cases where spreadsheet-based BI tools tend to be superior is operational tools. Imagine an eCommerce company delivering products to customers. You’re in the logistics team and want to make sure you’re reducing the number of late orders. You’ll use your order data, calculate for how long they’ve been pending, filter on the orders about to be late and you’ll want to make sure you take action on each of them with your team. In a spreadsheet, you can easily add comments and collaborate with your team.
Spreadsheet BI vs traditional BI
At this point, you might be wondering whether you should use a traditional BI tool at all. If you're at an early stage company, the answer is probably no. But otherwise, you should probably use both types of tools for what they’re great at. BI tools are great at creating visual dashboards that can be shared across the organization to align everybody on the key metrics of the business. BI or data teams control these dashboards and make sure there’s no mistake and the definitions of metrics are formalized. Spreadsheet BI tools are great to make operational teams more independent with their data needs and for operational dashboards and tools.

Jonathan Parisot
CEO & Co-founder
Actiondesk


Featured Companies
Here are some amazing companies in the Spreadsheet based BI.

Actiondesk connects to your SaaS & databases. It helps you pull raw d ...

QuickTable lets you use a spreadsheet-like interface to access, explor ...